IN/EFFLUX: Visualizing Snell Library Statistics
Access
Timeline
March 2016
Description
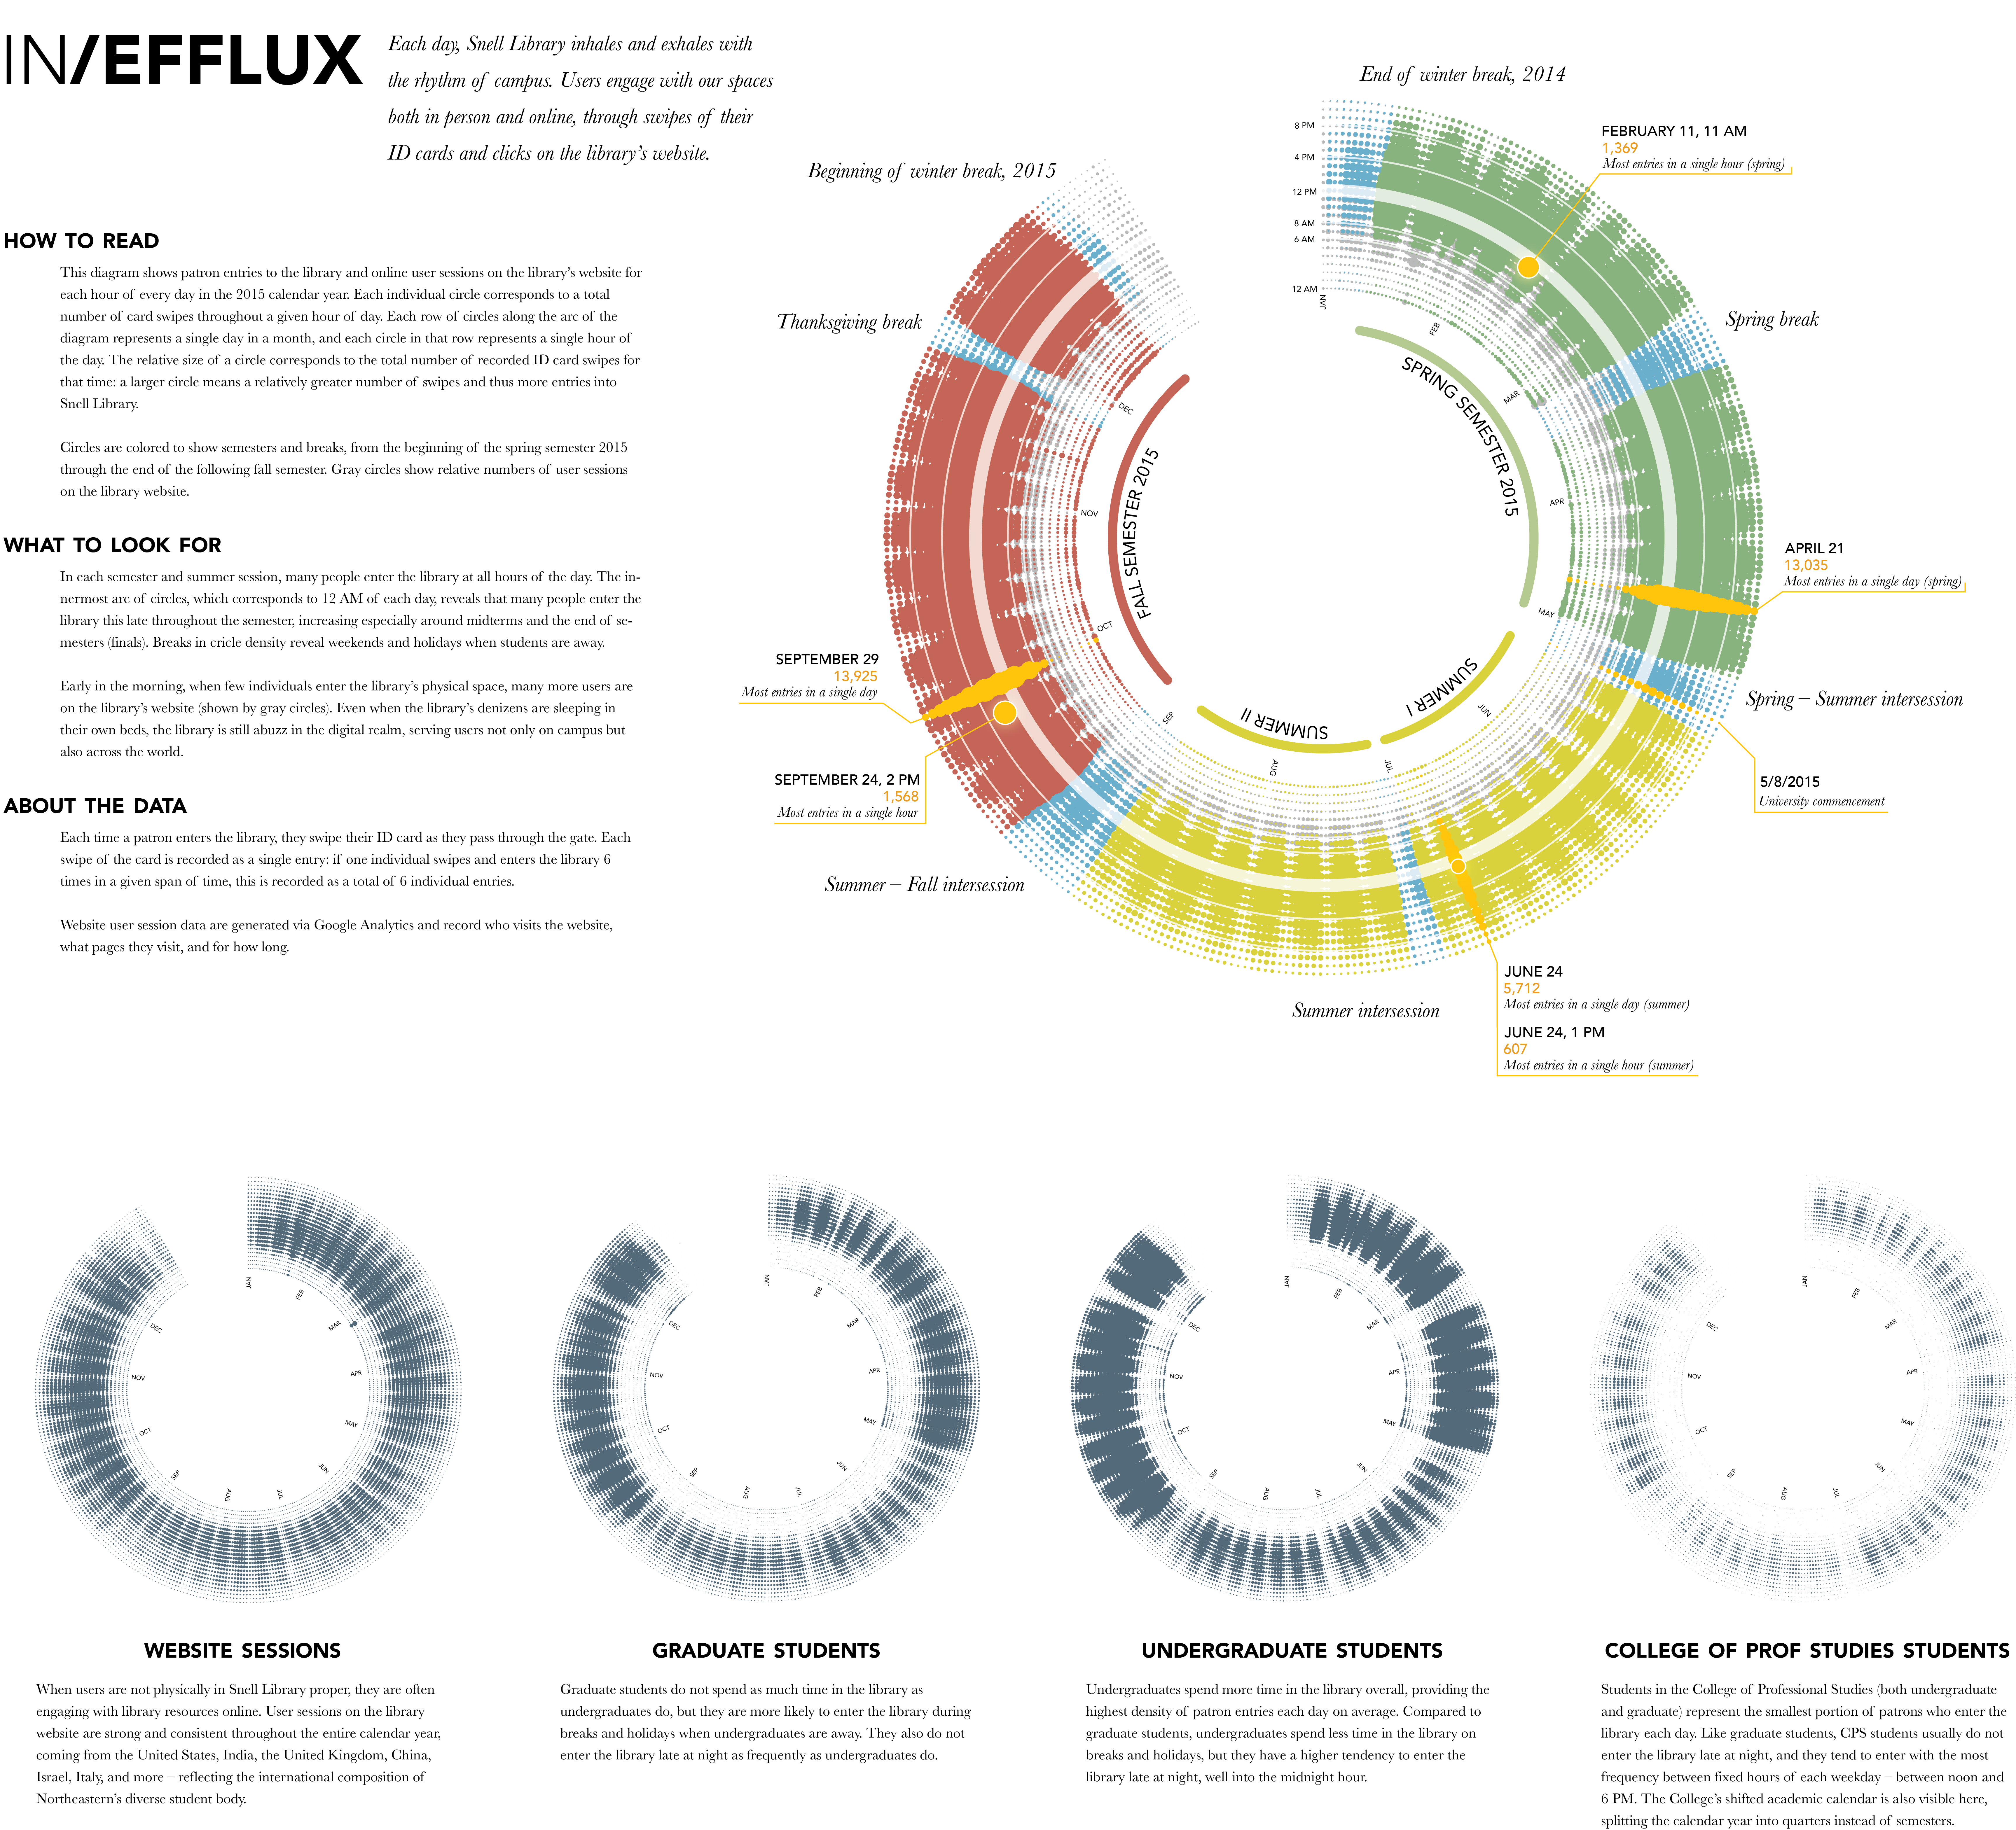
Traditional characterizations of library collections and spaces tend to focus on static measures of reach, such as collections size and frequency of reference desk consultations. While these kinds of measures provide some insight into libraries’ impact, they offer at best a snapshot of how patrons use their space and resources.
In this visualization, created for Snell Library at Northeastern University, I seek to portray the library as a living, breathing ecosystem in a way similar to my previous project “Visualizing Interlibrary Loan Transactions at University of Minnesota.” Using data about card swipes of patrons entering the library and Google Analytics data about user sessions on the library website for the calendar year 2015, I highlight the ways in which the library pulses with the rhythm of the campus, both in the physical realm as well as the digital.